Japanese Candlesticks Analysis 24.10.2014 (EUR/USD, USD/JPY)
24.10.2014
Analysis for October 24th, 2014
EUR USD, “Euro vs US Dollar”
The H4 chart of EUR USD shows a bearish tendency and a possible ending of a correction within the downtrend. Three Line Break chart indicates the downtrend; Hammer pattern and Heiken Ashi candlesticks confirm a bullish pullback.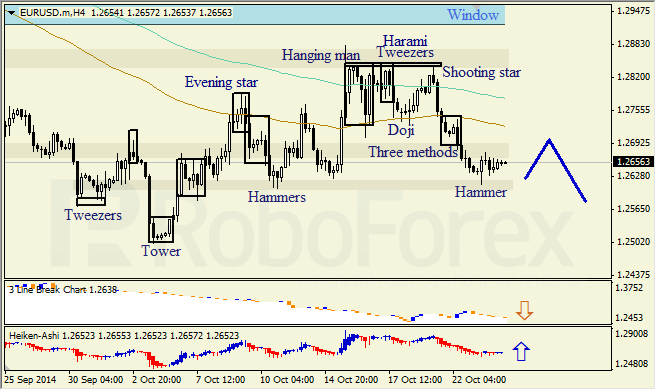
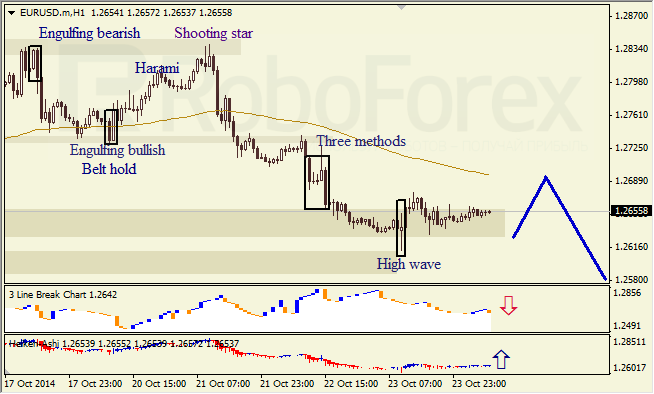
The H1 chart of EUR USD shows a sideways correction within the downtrend. Three Line Break indicates a bearish movement; High Wave pattern and Heiken Ashi candlesticks confirm that an ascending correction continues.
USD JPY, “US Dollar vs Japanese Yen”
The H4 chart of USD JPY shows a bullish tendency. Three Methods pattern below the upper Window indicates that the Window has been broken to the upside. Three Line Break chart indicates an ascending movement; Evening Star pattern and Heiken Ashi candlesticks confirm a bearish pullback.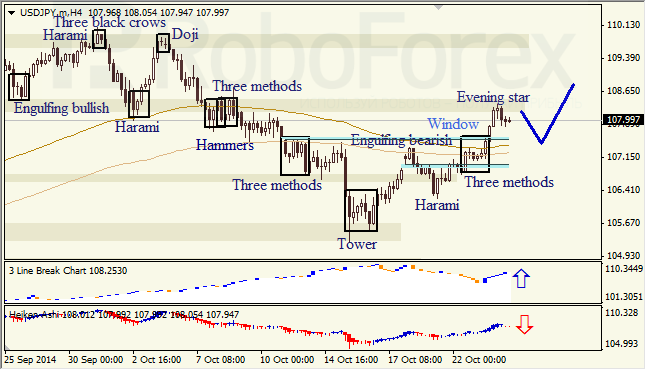
RoboForex Analytical Department
Attention!
Forecasts presented in this section only reflect the author’s private opinion and should not be considered as guidance for trading. RoboForex bears no responsibility for trading results based on trading recommendations described in these analytical reviews.