Japanese Candlesticks Analysis 06.03.2015 (EUR/USD, USD/JPY)
06.03.2015
Analysis for March 6th, 2015
EUR USD, “Euro vs. US Dollar”
At the H4 chart of EUR USD, the downtrend, which is indicated by Three Methods continuation pattern, continues. Three Line Break chart and Heiken Ashi candlesticks confirm a bearish movement.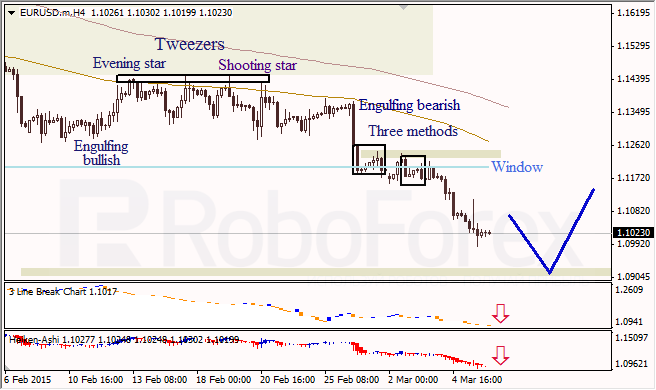
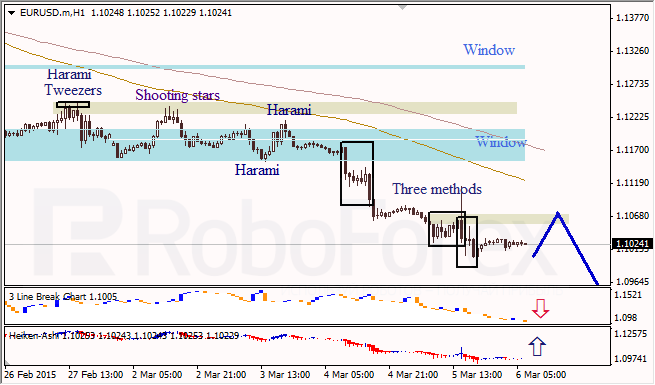
The H1 chart of EUR USD shows a sideways correction within the downtrend. Three Line Break chart indicates the downtrend; Three Methods pattern and Heiken Ashi candlesticks confirm the correction.
USD JPY, “US Dollar vs. Japanese Yen”
At the H4 chart of USD JPY, the upper Window is a resistance level. Three Line Break chart indicates the uptrend; Hanging Man and Harami patterns, along with Heiken Ashi candlesticks confirm a descending correction.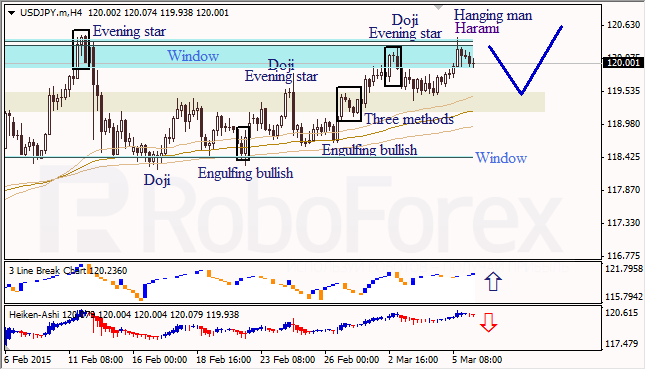
RoboForex Analytical Department
Attention!
Forecasts presented in this section only reflect the author’s private opinion and should not be considered as guidance for trading. RoboForex bears no responsibility for trading results based on trading recommendations described in these analytical reviews.